
Reporting metrics (map to live dashboards)
Canonical metric definitions for **Reporting metrics (map to live dashboards)**. In-product help deep-links to `/help/knowledge-base/metrics/reporting-and-credits/reporting-metrics`.
PDF and Excel reports reuse the same metric definitions as live SEO Overview, Rankings, and Pages dashboards whenever the template pulls those figures.
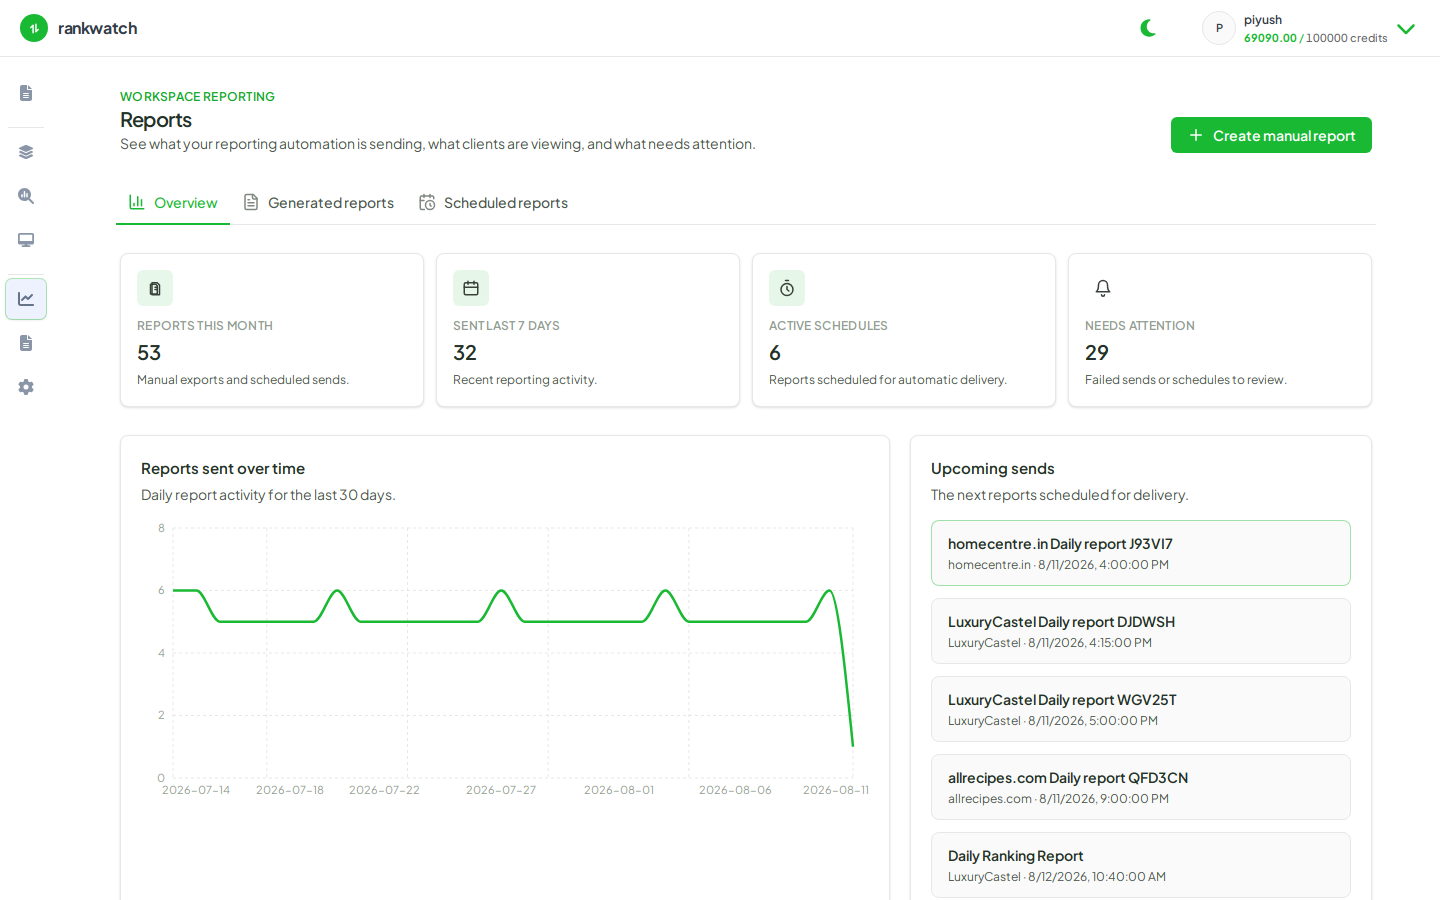
What maps to live dashboards
- Overview scorecards — Ranking keywords, distribution buckets, SOV %, est. traffic, traffic value — see SEO Overview metrics.
- Rankings / Pages tables — Column meanings match SEO Rankings table metrics and SEO Pages table metrics.
- Period-end snapshot rules — Report bundles use end-of-range snapshot semantics for scorecard-style figures and the selected reporting period for series, aligned with How RankWatch metrics work.
Notes
- Only ready report templates can generate PDFs today; template availability is package- and product-gated.
- Branding presets change presentation, not metric math.